The Role of Eye Diagrams in High-Speed Optical Design
In the world of high-speed digital design, maintaining signal integrity is imperative for ensuring reliable performance. Whether you're designing for advanced aerospace systems, defense-grade communication networks, or high-speed telecom infrastructure, the ability to trust your signal path is essential. That’s where eye diagrams come into play.
In this article, we’ll take a closer look at how eye diagrams work, what they reveal, and how they support performance in optical connectors.
Understanding Eye Diagrams: A Key Tool for Signal Integrity Analysis
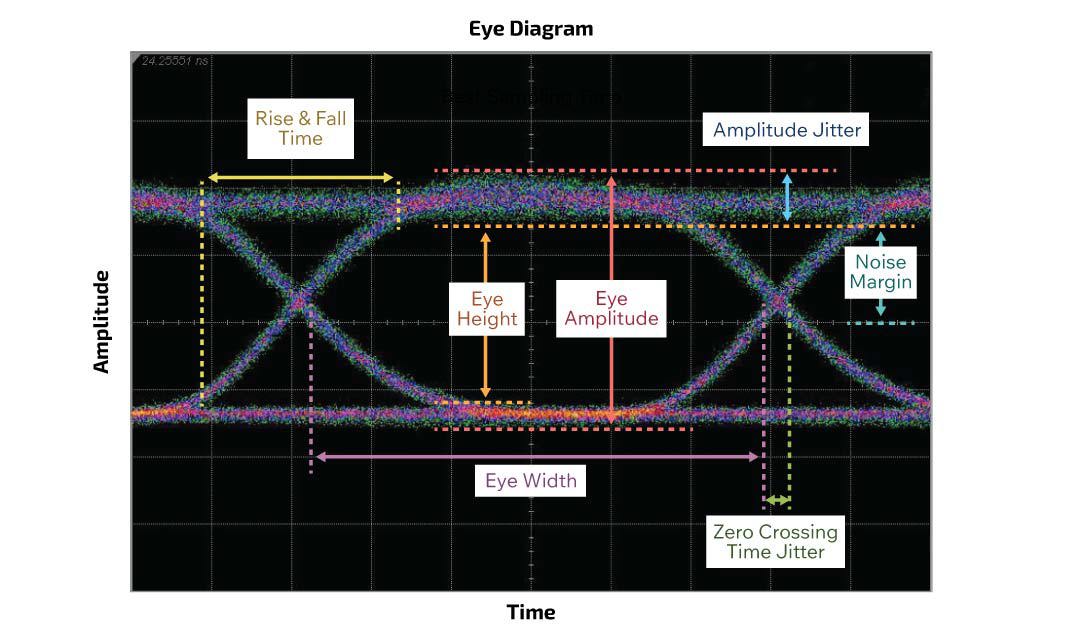
An eye diagram is a visual representation of a digital signal over time, formed by capturing multiple images of a signal’s waveform and superimposing them over one another. The resulting image takes on a distinct eye-like shape, from which engineers can discern important signal characteristics, such as jitter, amplitude noise, rise and fall times, and overall signal clarity.
Eye diagrams are commonly generated using high-speed oscilloscopes or bit error rate testers (BERTs). The equipment triggers on a known clock and overlays thousands of captured images to form a statistical snapshot of signal behavior. This allows engineers to detect subtle deviations caused by interconnect losses, reflections, impedance mismatches, or external interference.
The technique is widely used in industries where digital accuracy is critical. From aerospace flight control systems and defense communications to data center networking and 5G telecom infrastructure, eye diagram analysis is a foundational tool for verifying whether a digital transmission system can operate reliably under real-world conditions.
How to Read Eye Diagrams: Jitter, Noise, and Bit Error Rate Explained
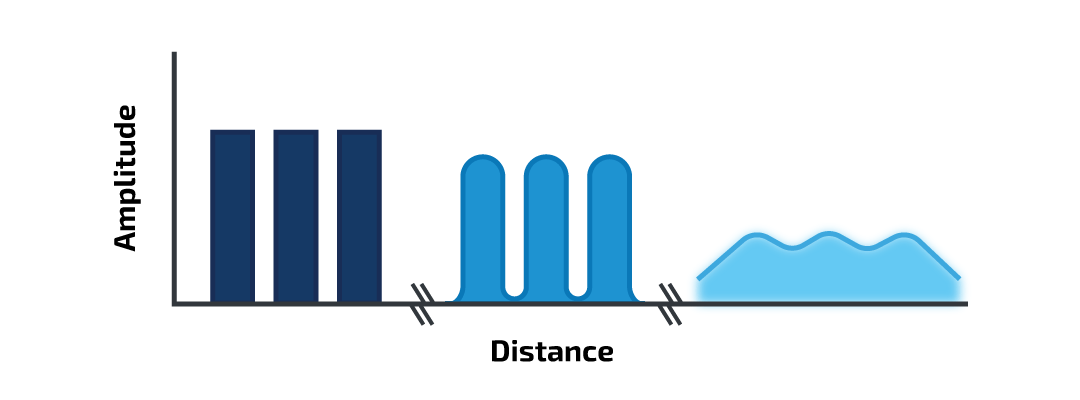
A well-formed eye diagram gives engineers a visual benchmark for evaluating the performance of high-speed digital signals. The most prominent feature is the “eye opening.” A wide and tall eye opening generally indicates strong timing margins and healthy amplitude levels. Conversely, a narrow or short eye opening often signals degraded signal integrity.
Jitter: A critical aspect of signal integrity, jitter is typically revealed by horizontal blurring at the transition edges in an eye diagram. Timing jitter reduces the certainty of when a signal crosses logic thresholds, making bit errors more likely. In high-speed applications, even minor timing fluctuations can compromise data integrity.
Amplitude Noise: Typically seen in the vertical scatter of an eye diagram’s waveform, amplitude noise can result from crosstalk, electromagnetic interference (EMI), or losses in the transmission path. If the upper and lower voltage levels begin to collapse inward, the bit states become less distinguishable, and the signal approaches its noise margin.
Bit Error Rate: Although Bit Error Rate (BER) is typically measured statistically, eye patterns offer visual cues about the likelihood of bit errors by showing how consistently the waveform meets logical thresholds across cycles. A high BER can lead to increased data retransmissions, degraded throughput, and even system-level failures.
Eye Diagram Testing for Fiber Optic Networks and High-Speed Transceivers
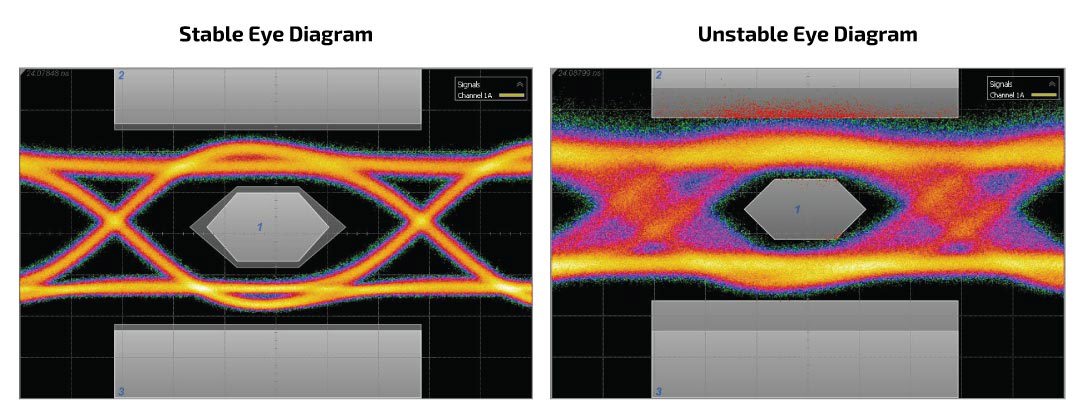
Eye diagram testing is a fundamental technique used to validate the performance of optical communication systems, especially as data rates continue to scale into the multi-gigabit and terabit range. In fiber optic networks, signal integrity is critical, not just for throughput, but for ensuring compliance with stringent standards and maintaining long-term reliability in high-bandwidth environments.
When evaluating optical transceivers or media converters, engineers use eye diagrams to assess how the transmitted waveform holds up across the fiber channel. These tests reveal the impact of modal dispersion, attenuation, noise, and non-linearities introduced by the optical path. A clean eye pattern indicates that the laser source, receiver circuitry, and physical media are working in harmony to preserve the integrity of digital data.
Eye Diagram Testing for Multi-Gigabit Fiber Systems
Eye diagram analysis is especially valuable in verifying performance under temperature stress, voltage fluctuation, and varying fiber lengths. Whether dealing with short-reach 10G optical modules or long-haul 100G transceivers, these tests help determine whether the system will function reliably under real-world load conditions.
Advanced optical systems operating under protocols such as Ethernet, Fibre Channel, PCIe, or Infiniband all rely on eye diagram testing during validation. Engineers examine waveform consistency, track bit error rate probabilities, and use compliance masks to check alignment with standard specifications. This ensures that optical components, whether used in data centers, telecom infrastructure, aerospace, or industrial networks, are qualified for deployment at scale and in environments where signal performance must be guaranteed.
Using Eye Diagrams to Ensure Standards Compliance
Eye diagram testing plays a central role in confirming compliance with a wide range of industry standards that govern high-speed digital signaling. These standards specify acceptable limits for jitter, voltage noise, bit error rate (BER), and overall signal fidelity. By analyzing waveform characteristics through eye diagrams, engineers can determine whether a signal meets defined performance thresholds and is suitable for deployment in critical systems.

One essential tool in this evaluation is the compliance mask, a graphical overlay used during eye diagram analysis to define the acceptable boundaries of a signal’s performance. The mask typically consists of one or more shaded or outlined regions superimposed over the eye diagram. If any part of the waveform touches or enters the prohibited zone, the signal fails compliance. This immediate visual cue simplifies the pass/fail determination and supports automated testing workflows.
Meeting Protocol-Specific Standards with Compliance Masks
Compliance masks are tailored to specific protocols and data rates, such as Ethernet (IEEE 802.3), PCI Express, USB, or Fibre Channel. For example, a 10GBASE-SR Ethernet signal will have a different eye mask than a PCIe Gen5 link. Each defines minimum eye height and width requirements based on voltage thresholds and timing limits set by the relevant standards body.
| Standard | Governs | Data Rates Supported | Eye Diagram Compliance Focus |
|---|---|---|---|
| IEEE 802.3 (Ethernet) | Wired LAN communication protocols | 10 Mbps to 400 Gbps | Jitter tolerance, voltage thresholds, eye height/width requirements for protocols like 10GBASE, 100GBASE |
| PCI Express (PCIe) | Internal high-speed serial communication between system components | Gen1 (2.5 GT/s) to Gen5+ (>32 GT/s) | Signal integrity across PCB traces; compliance masks for each generation based on eye width, jitter budget, and voltage swing |
| USB | External peripheral communication | USB 2.0 (480 Mbps) to USB4 (40 Gbps) | Compliance with timing transitions and voltage levels; masks differ between high-speed (HS) and SuperSpeed (SS) modes |
| Fibre Channel | High-speed storage networking | 1 Gbps to 128 Gbps and beyond | Jitter analysis, pulse amplitude consistency, and logic level separation for fiber optic transmission lines |
Table 1: Common Signal Standards and Eye Diagram Compliance Characteristics
In practice, engineers use these masks to assess whether a device under test can consistently transmit clean, interpretable signals across millions of cycles. Testing may be conducted at nominal operating conditions as well as under temperature extremes, voltage variations, and simulated system stress. Combined with metrics like BER and jitter tolerance, compliance masks help ensure that digital systems, whether optical, electrical, or hybrid, meet regulatory requirements and deliver robust performance in the field.
Key Advantages of Eye Diagram Testing
In high-speed digital design, eye diagram testing provides engineers with a reliable method for verifying signal quality and ensuring data transmission meets expectations under real-world conditions. Unlike static specifications or simulation results, eye diagrams offer empirical insight into how a signal performs over time, revealing issues that might otherwise go unnoticed.
Beyond diagnostics, eye diagrams also play a major role in system optimization. Comparing different transmission setups visually allows designers to choose the best configurations. This approach enables quick identification of the most effective combinations of components, termination strategies, and equalization settings.
The Future of Eye Diagram Testing in High-Speed Digital Design
Eye diagram testing remains one of the most effective tools for evaluating digital signal integrity, especially as systems push into faster, more complex data transmission domains. By analyzing waveform shape, timing accuracy, and noise performance in real time, engineers can quickly identify signal impairments that might compromise reliability.
As digital systems continue to evolve, the need for precise, visual validation will only grow. Eye diagrams provide clarity, reduce uncertainty, and help engineers move forward with confidence, knowing their signals are ready to meet the challenges ahead.
Explore Cinch’s full portfolio of high-speed optical interconnects, tested for signal integrity performance and engineered to meet the demands of critical applications.
 Optical Transceivers
 Media Converters
 Expanded Beam Connectors